According to McKinsey, around 59-72% of trade promotions are unprofitable – a reality many companies don’t realize applies to their own efforts. To know whether your promotions fall into this category, you need clear, reliable data on each promo’s performance.
With data scattered across spreadsheets, manual calculations, delayed reports, and unclear metrics tracking, measuring trade promotion effectiveness would be an impossible task.
In this article, we’ll help you navigate this complex process of trade promotion effectiveness measurement. You’ll also learn what to measure and how to measure, so the numbers actually support better decisions.
Why Trade Promotion Effectiveness Analysis Is Key to Better Results
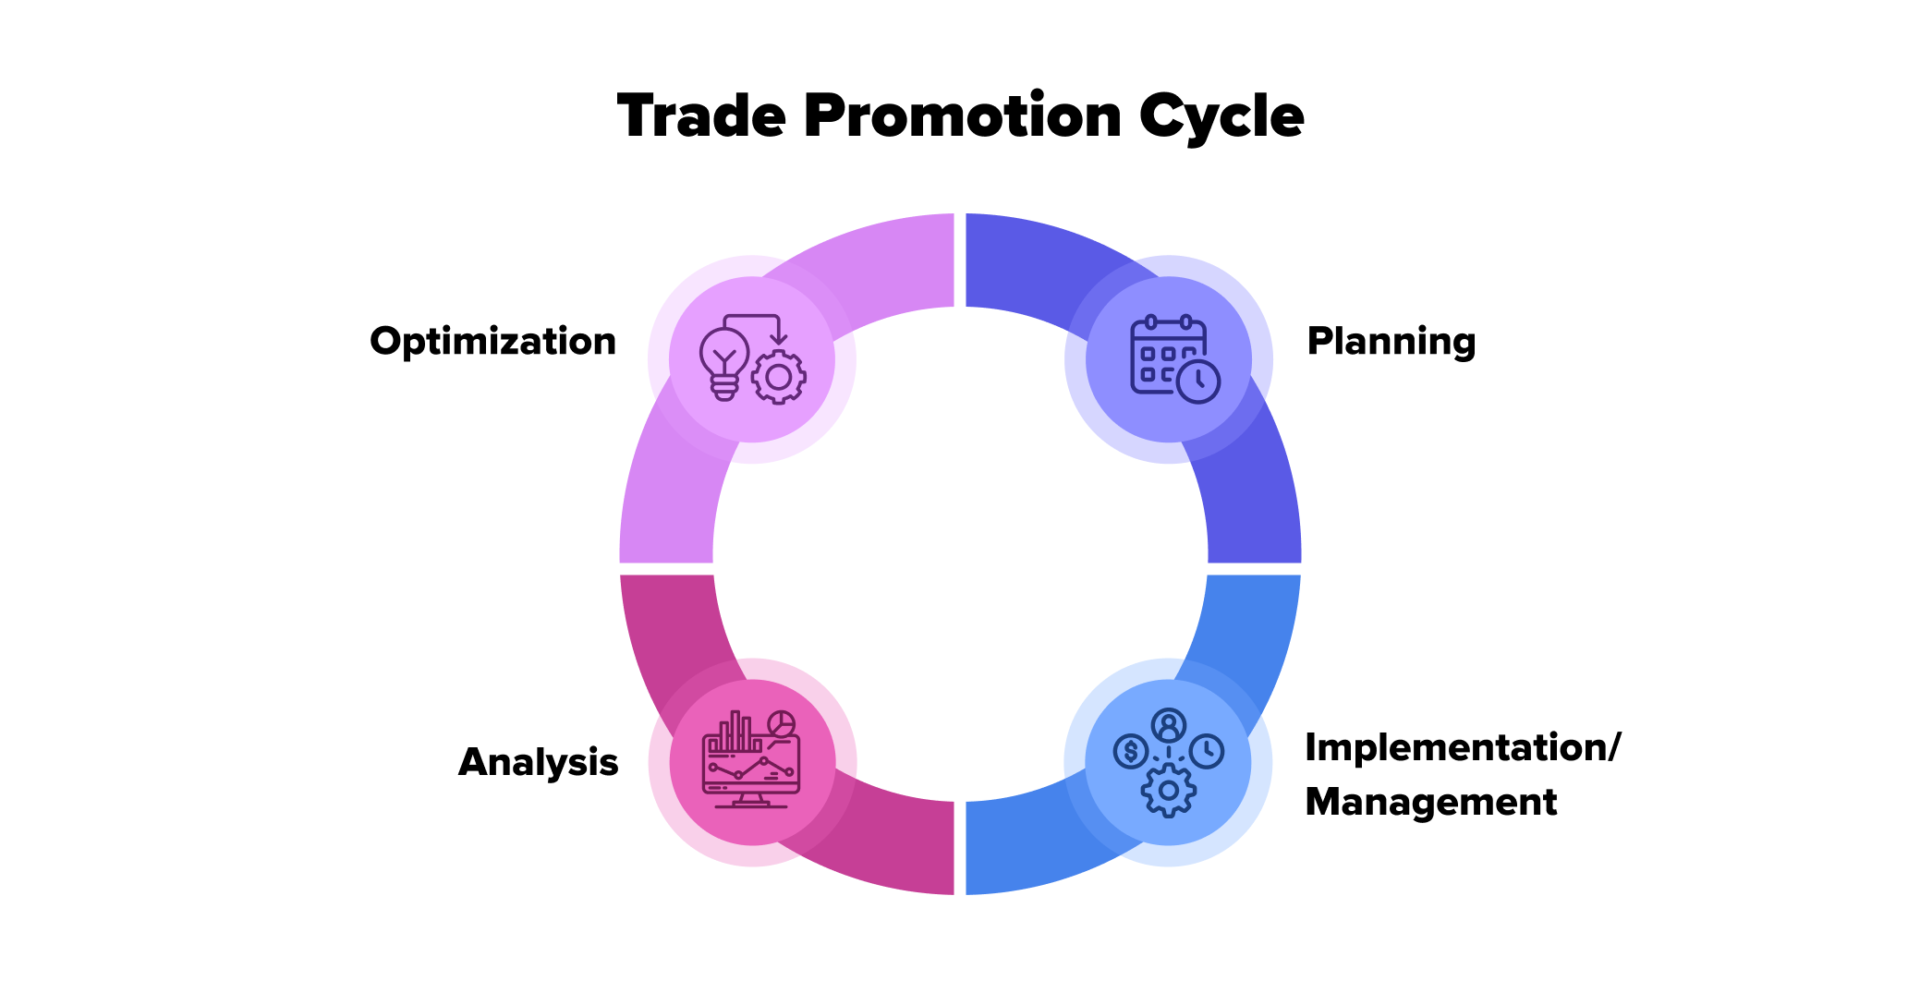
Within the promo cycle (planning, implementation/management, analysis, optimization), analysis is the most critical stage.
Trade promotion effectiveness analysis reveals the actual impact of promotions – how they affect sales, revenue, and profitability. Moreover, it highlights opportunities to improve results and marketing strategies.
With multi-million budgets at stake, even a 1% cost optimization or a small increase in efficiency can translate into significant savings.
In the long run, the proper trade and post-trade promotion analysis also gives a competitive advantage. It helps companies understand shopper behavior better, plan better promotions, and build stronger retailer relationships, in contrast to competitors who rely more on intuition than data.
Measuring trade promotion effectiveness isn’t just about a few formulas. It’s a full process – and we’ll walk through its key aspects.
Key Aspects of Trade Promotion Effectiveness Analysis
Tracking sales here and there isn’t enough for analyzing promotion effectiveness. It’s a systematic approach that shows how trade promos contribute to both short-term results and long-term goals. To make this connection, the first step is to understand how to measure success in a structured way.
That’s why we will start with the evaluation aspect, since it provides the foundation for all further analysis and optimization.
Evaluating Effectiveness
Imagine this: during a promotional campaign, a certain product reached new households and became one of the regular items in their shopping basket. The manufacturer will see this effect later – in repeat purchases, stronger brand loyalty, and a steady increase in market share.
However, if the promotion doesn’t benefit the company here and now, it risks becoming a cost without immediate return. As a result, it may undermine both cash flow and the ability to invest in future growth.
That’s why a structured evaluation must balance immediate financial outcomes with longer-term strategic impact. To do this, companies use measurable indicators (KPIs) that make promotions easy to track and compare.
Key Performance Indicators (KPIs)
To evaluate, we need numbers (data) and clear methods to calculate them. Here’s the basic trade promotion effectiveness analytics metrics FMCG companies use:
Incremental Sales
The extra units sold thanks to the promotion, compared to what would have sold anyway.
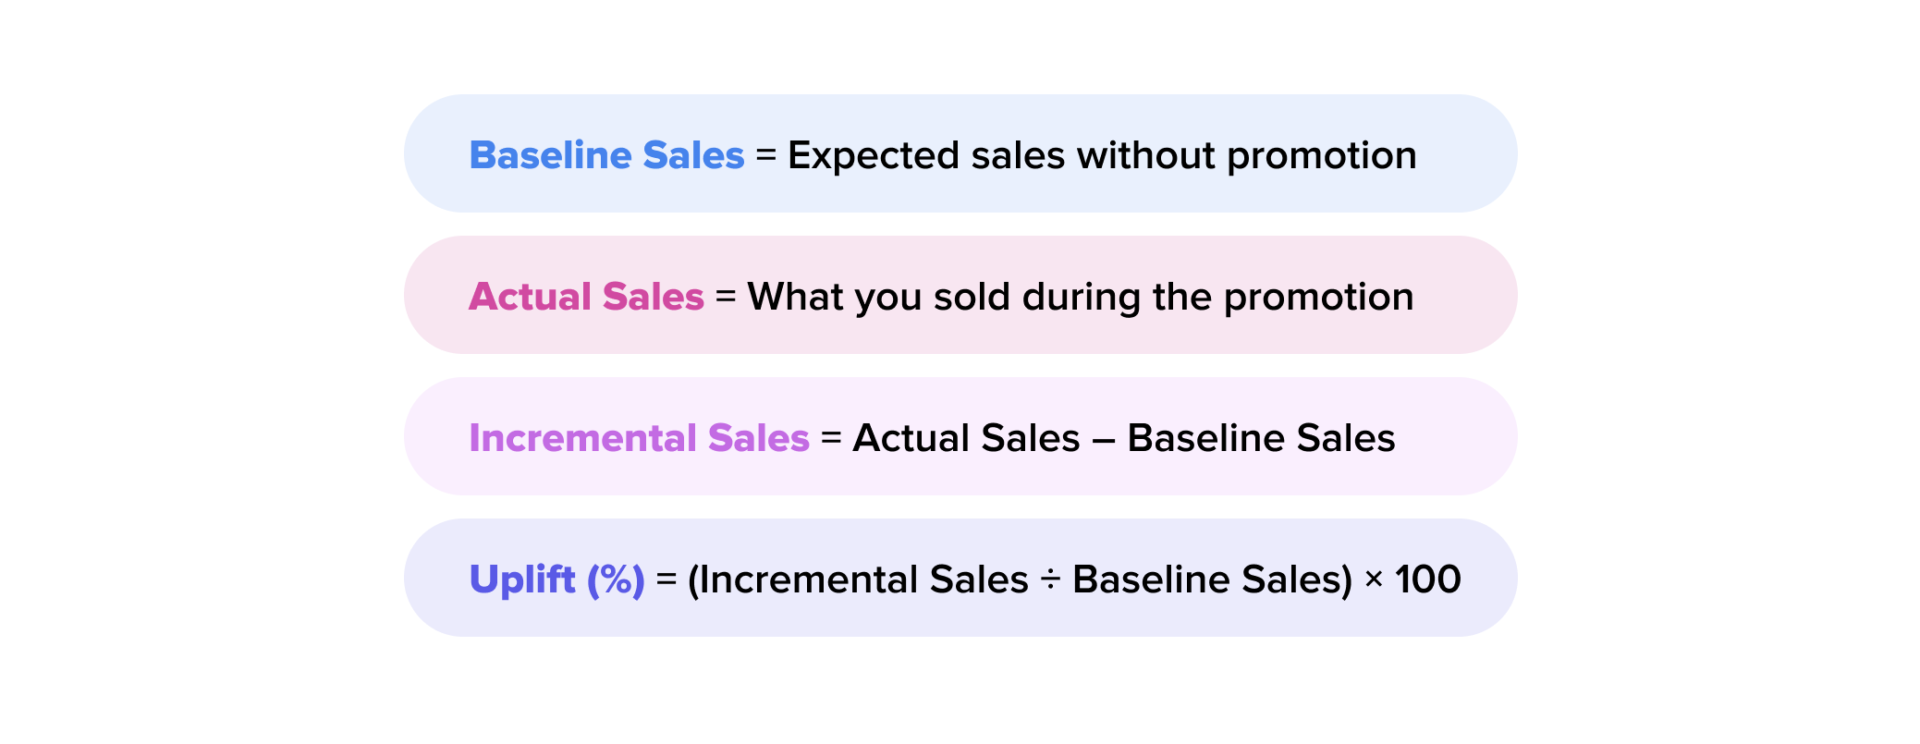
Baseline Sales
The expected sales without any promotion, exist as the reference point for measuring impact.
Profitability
The financial gain from the promotion, after deducting costs like discounts and offers, logistics, and marketing.
Return on Investment (ROI)
A ratio showing how much profit the promotion generated compared to what was spent on it.
We’ll go into more detail on each of these later, showing the formulas behind them.
Data-Driven Approach
Imagine trying to judge a promotion with numbers scattered across different spreadsheets, some missing, some corrected by hand. The picture will never be clear.
That’s why companies need a systematic approach to collecting, storing, and analyzing data. When the data is accurate and well-organized, the analysis becomes objective, mistakes are reduced, and there’s no room for “fixing” the results.
Now, it’s finally time to dive into those key trade promotion effectiveness analytics metrics we’ve mentioned before.
How to Apply the Trade Promotion Effectiveness Metrics
While trade promotion effectiveness analysis goes far beyond just calculating metrics, those metrics form its core. Let’s see how they should be applied in practice.
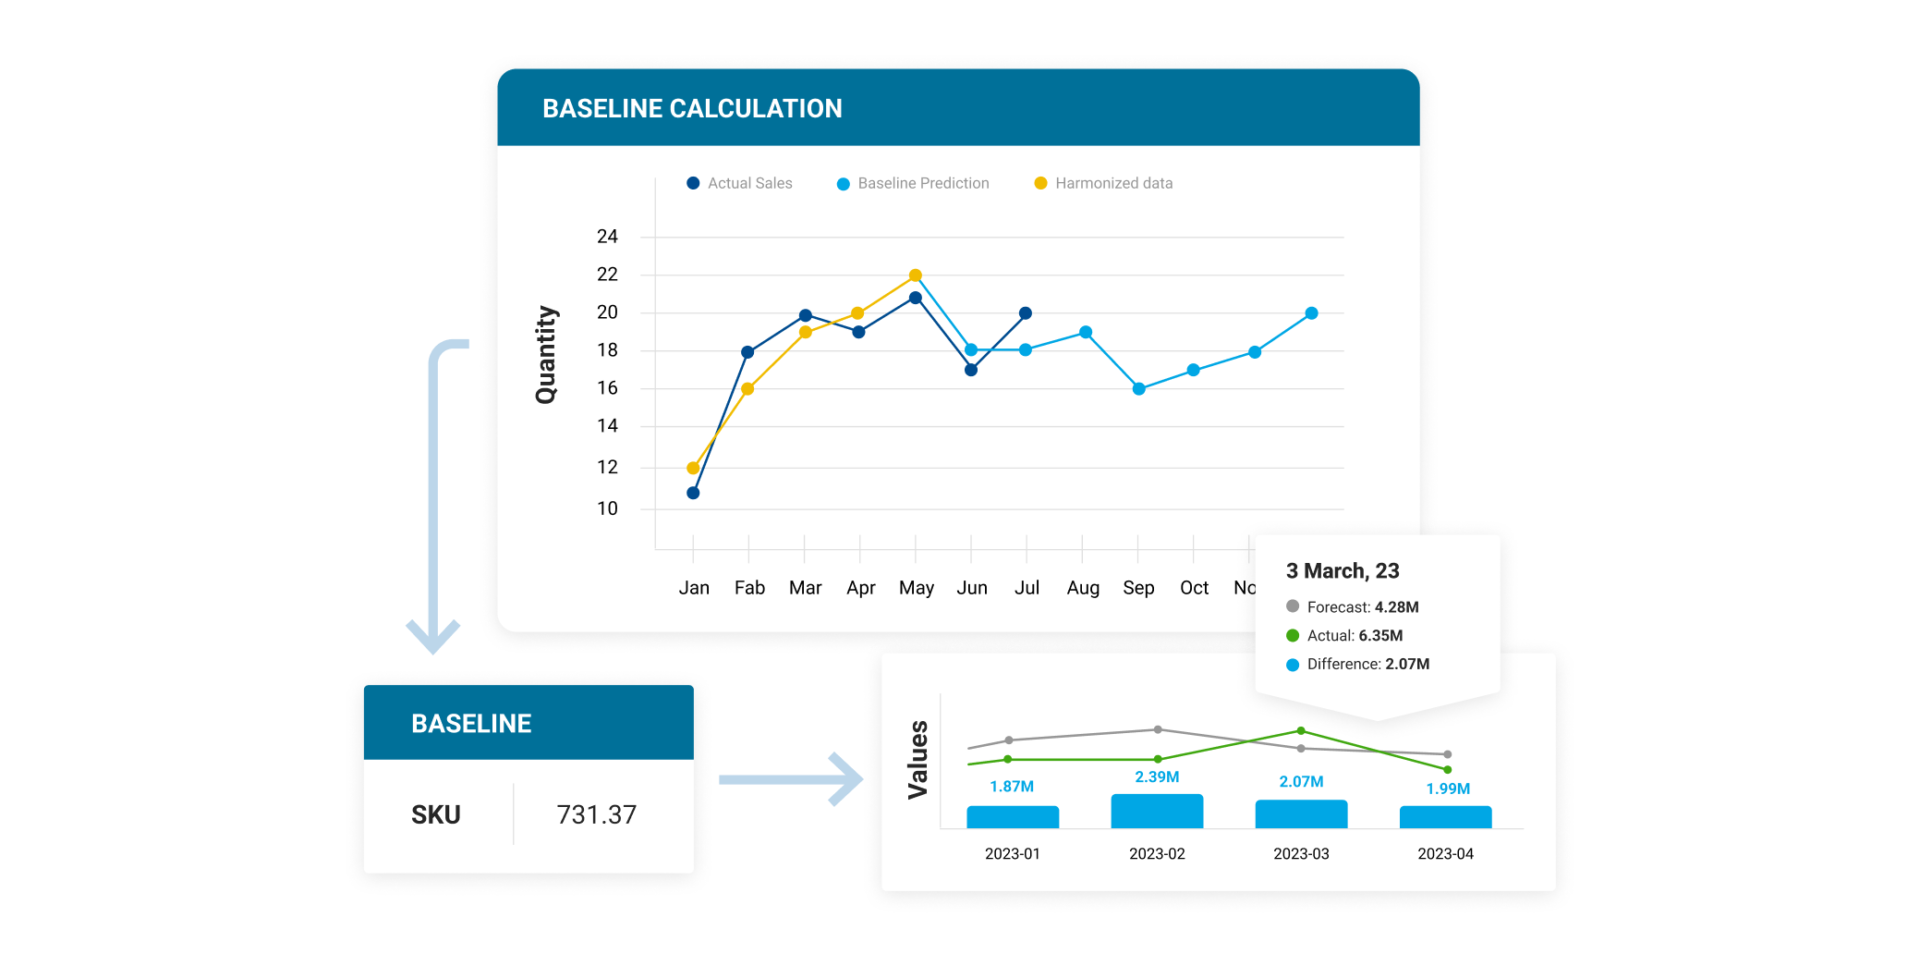
Baseline Sales
Baseline shows how many units a manufacturer would have sold without any promotion.
Figuring out that number isn’t easy. Usually, you look at historical data… and that’s where the problem starts.
For many companies, managing data is a constant struggle. Numbers are scattered across different systems, incomplete, or just plain messy. If your data isn’t systematized, your baseline estimate can make a promo look better or worse than it really is.
To get a reliable baseline, you need:
- Solid historical sales data over similar periods
- Adjustments for seasonality, holidays, or market trends
- Awareness of external factors like competitors or stockouts
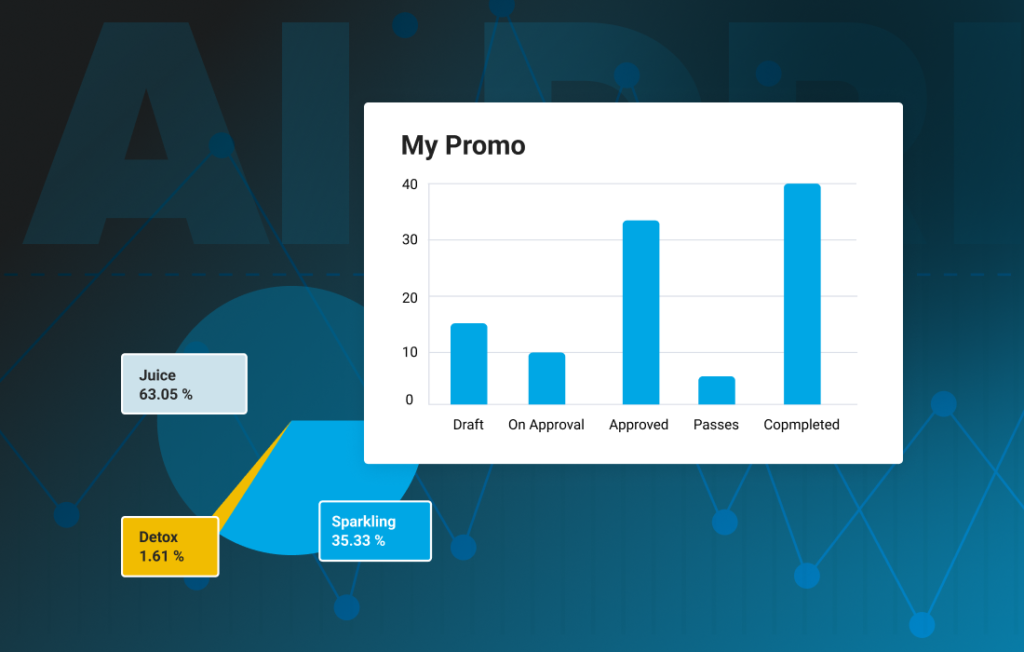
Advanced FMCG companies don’t calculate the metric manually. ML-driven solutions, such as SSBS’s Trade Promo Management software, do the work automatically.
Not there technically yet? There are two ways in which companies without a proper database calculate baseline sales.
Reference Period Manual Method
Look at the average past sales from a few weeks before the promotion. Then:
- Add up the sales units for those weeks.
- Divide by the number of weeks (or days, if using daily data).
- That number becomes your baseline sales per week/day.
Look at the example:
- Week -3: 950 units
- Week -2: 1,000 units
- Week -1: 1,050 units
Average = (950 + 1,000 + 1,050) ÷ 3 = 1,000 units/week baseline
This method is quick and simple, but it ignores trends and seasonality. It’s best for stable products.
Linear Regression Manual Method
Instead of averaging past sales, this method uses a formula that adjusts for trends and seasonality:
- Trend: Captures whether sales are generally rising or falling over time. For example: Sales = 950 + 20 × Week → sales grow by 20 units each week.
- Seasonality: Adjusts for recurring peaks or dips (holidays, summer, back-to-school, etc.). For instance: +200 units in December, –100 in January.
How it works:
- Fit a line: Sales = a+b×time
- Add seasonal factors where needed.
- For each week of the promotion, use the formula to calculate expected sales without the promo.
Look at the example:
Week -3: 940 (trend says it should be lower in January)
- Week -2: 960
- Week -1: 980
- Promo week baseline = 1,000
- Actual promo sales = 1,500 → Incremental = 500 units.
The linear regression way is more accurate than the reference period method, but it still requires some data prep and validation.
For the one-month method, you will need either special AI-powered TPM software or separate ML models, like LightGBM. In both cases, AI/ML requires a substantial amount of high-quality data.
Uplift and Incremental Sales
The incremental sales metric measures the true impact of a campaign – only the most effective promotions generate incremental sales. It represents the additional sales on top of the baseline.
This trade promotion effectiveness KPI is an absolute number and can be calculated through different units (kilograms, liters, pieces).
Unfortunately, the increase in the number of sold units doesn’t necessarily mean the promotion was profitable.
Sometimes, the extra sales come at a cost that outweighs the revenue gained, or they simply shift purchases that would have happened anyway. That’s why analyzing incremental sales alongside costs, margins, and cannibalization is crucial to understanding a promotion’s real effectiveness.
Uplift, on the other hand, is a broader term that can mean either an absolute or percentage increase, depending on the context. Sometimes, people use “uplift” as a synonym for incremental sales (when talking about absolute numbers). But don’t let that confuse you – the actual definition is the percentage ratio of incremental sales to the baseline.
Profitability
Profitability shows the extra profit a company makes from incremental sales after covering all the costs of a promotion, such as discounts, marketing, logistics, and other related expenses. And yes, it can be negative.
The formula is: Profitability of Promotion = Incremental Sales × Unit Margin – Trade Spend
We’re not measuring the entire business, just the “extra” impact of the promotion.
Let’s look at the example:
- Baseline sales: 1,000 units
- Actual sales: 1,400 units
- Incremental sales = 400 units
- Selling price = $10 per unit
- COGS = $6 per unit
- Unit margin = $10 – $6 = $4 per unit
- Trade spend (discounts, marketing, logistics) = $1,000
Now, let’s calculate: Profitability = 400 × 4 − 1000 = 600
In this case, the promotion is profitable. But if trade spend had been $2,000, the result would have been –$400 (a loss).
Many promotions don’t generate a positive profit; they actually cause losses. That’s why it’s so important to look beyond just sales numbers.
What to Watch Beyond the Numbers
When thinking about profitability, keep a few things in mind:
- Some “extra” sales simply replace regular ones of the same product (cannibalization), so they don’t really add to the profit.
- Short-term gains might hurt long-term profits if customers only buy when things are discounted or if brand value takes a hit.
- Hidden costs like stockouts, extra handling, or operational headaches can eat into your profits.
- Profitability can vary by channel, region, or customer segment, so a promo might work in one place but not another.
- Comparing promos to past results or industry benchmarks helps understand what “good” really looks like.
Return on Investment (ROI)
Profitability shows the net profit from a promotion after covering both the cost of goods sold and other promotion expenses. ROI calculation in FMCG puts that profit into perspective by comparing it to the total investment in the promotion, which is fundamental to trade spend management.
It’s calculated as:
ROI (%) = (Profitability after COGS ÷ Trade Spend) x 100
Let’s apply it to our earlier case:
- Incremental revenue = $4,000
- Profitability (after COGS) = $1,600
- Trade spend (discounts, marketing, logistics) = $1,000
- Profitability = $600
ROI (%) = ($600 ÷ $1,000) × 100 = 60%
This means that for every dollar spent on the promotion, the company earned an additional $0.60 in net profit.
If trade spends had been $2,000 instead, the profitability would have been –$400, and the ROI would be:
ROI (%) = (–$400 ÷ $2,000) × 100 = –20%
Analyzing the effectiveness of a trade promotion in CPG is far from easy, even beyond these calculations. Let’s discuss the most common FMCG challenges related to promo analysis.
Challenges in Trade Promotion Analysis
FMCG companies face numerous hurdles every day in obtaining clear, reliable trade promotion analytics – a critical step in achieving a successful digital transformation in FMCG.
Unstable Macroeconomic Situation
The past few years have brought unprecedented disruptions – COVID-19, supply chain crisis, rising inflation, and now new tariffs.
These external factors distort consumer behavior and sales patterns. Economic pressures make them focus on essentials while cutting back on extras. At the same time, cultural shifts drive demand for healthier options.
It’s hard to isolate the real impact of promotions in such conditions.
Data Quality Issues
When information is spread across different spreadsheets and tools, and people can manipulate data as they see fit, it often results in misleading numbers, inconsistent formats, gaps, duplicates, and delays.
Calculating baselines, incremental sales, and ROI becomes not only time-consuming but also unreliable.
Lack of Analytical Tools
Even with good data, relying on manual calculations or basic reporting systems makes it difficult to measure KPIs. You saw those calculations in the previous paragraph – and considering the number of trade promotions companies typically run, it’s almost impossible to scale this process manually.
Without proper analytical tools, teams spend more time collecting and cleaning promotion and post-promotion data than actually analyzing it.
Lack of Expertise
Baseline calculation is the cornerstone of promo effectiveness, but it requires methodological knowledge. Many teams lack the expertise to apply methods like reference periods or regression correctly, which often leads to overestimation or underestimation of promo results.
Retail Execution Challenges
Even the best-designed promotions can fail in the field. Poor compliance, missing displays, out-of-stocks, or wrong pricing at the shelf significantly reduce effectiveness. This weakens the immediate results and distorts the evaluation of marketing strategies and mechanics.
Leading FMCG players know how to navigate these challenges, and in the next section, we’ll show you how they do it.
Best Practices and Future Trends
We see three main routes your FMCG business (or CPG – the difference between FMCG and CPG isn’t that important here) can take to strengthen trade promotion effectiveness analytics.
Continuous Optimization Through Cyclical Analysis
Promo effectiveness isn’t a one-time calculation. The best FMCG companies treat it as a cycle: plan → execute → measure → learn → adjust.
Considering the number of promo campaigns running across products, regions, and channels, this cycle quickly becomes too complex to manage manually.
To make this process automatic and scalable, companies turn to TPM/TPO tools and Machine Learning models. These solutions consolidate data, uncover hidden patterns, and provide actionable insights for evidence-based decisions.
Let’s talk more about that.
TPM and TPO Platforms, Integrated with SFA
The implementation of Trade Promo Management (TPM) and Trade Promotion Optimization (TPO) platforms brings structure to planning, execution, and analysis.
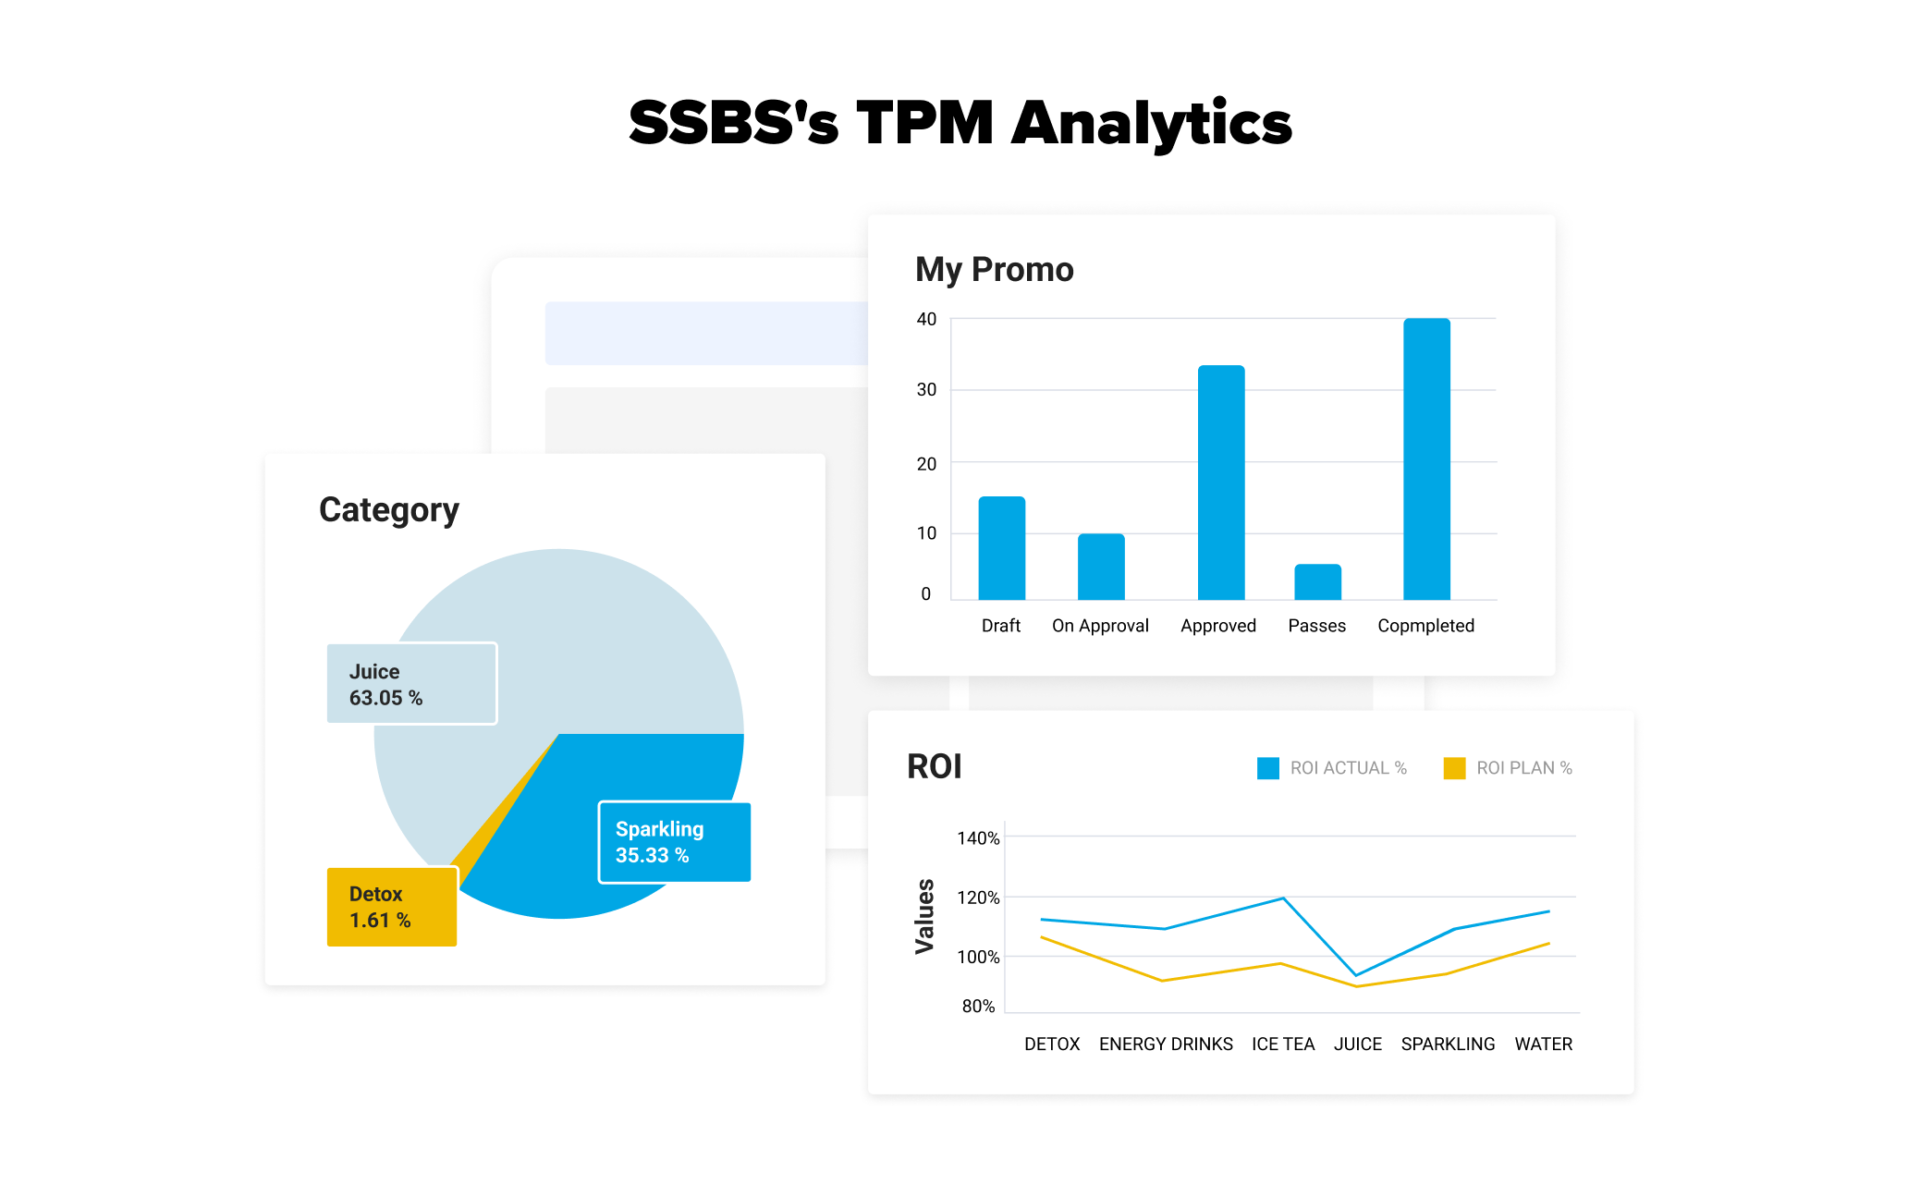
Let’s take SSBS’s solution, for example. For our clients, it acts as a data hub and an analytics engine at the same time:
- Collects and organizes all historical data.
- Calculates KPIs and metrics, like baseline, for each product, customer, and period.
- Forecasts KPIs and metrics for future periods using ML models.
- Analyzes historical results to recommend promo mechanics, discounts, assortments, and sales targets.
- Monitors competitor activity through open sources, syndicated research, and in-house tracking, then compares and contextualizes results.
When connected to SFA (any SFA, including our SalesWorks), the solution:
- Creates a closed loop: field data flows directly into promo planning and evaluation.
- Provides marketing, financial, and sales teams with a single source of truth.
- Reduces errors by eliminating manual data handling.
- Speeds up reporting.
Leveraging AI and Machine Learning for Forecasting
Artificial intelligence and Machine learning in FMCG are becoming an indispensable part of most industry-tailored solutions – from FMCG distributor management to FMCG Image Recognition solutions. ML and AI in trade promotion analyze vast amounts of historical data, market signals, and external factors to predict promotion outcomes more accurately than traditional methods.
Machine Learning models can even be used as separate trade promotion forecasting tools. They also adapt over time, continuously improving the precision of their forecasts.
Conclusion
Calculations of key trade promotion effectiveness metrics are a continuous closed loop. Moreover, it is a crucial part of an even larger cycle.
While leading manufacturers are competing to see who has automated these cycles most efficiently, others are diverting their resources to manual processes, spending time on spreadsheets, repetitive calculations, and delayed reporting, rather than focusing on their trade promotion strategies and growth.
Need help automating the process of measuring trade promotion effectiveness? Drop us a line!