FMCG brands spend roughly 20-23% of their revenue on trade promotions. It’s usually one of the largest P&L items after cost of goods. Up to 40% of that investment is lost.
So, even if your net revenue management brand strategy looks sound on paper, the data suggests the budget still should raise some questions.
The leakage is almost always in the execution infrastructure, and not in the strategy. Let’s see how to solve it.
What Is Net Revenue Management in FMCG?
NRM (net revenue management) focuses on the revenue left after all discounts, promotions, and channel costs are taken out.
It connects five areas: product range, pricing, sales mix, promotions, and trade agreements.
You probably know this net revenue management definition already. Most NRM managers at FMCG brands do.
What’s changed in the last few years is the bar for what “good” net revenue management for FMCG actually looks like.
Teams used to review category decisions quarterly. Today, leading consumer goods brands manage growth and profitability at SKU, customer, and store level using data that’s days old, not weeks.
If your net revenue management analytics still look like monthly reports, you are working with a lag that your competitors have already closed.
Why Does NRM Break Down in Practice?
Net revenue management in CPG often loses impact where strategy meets execution: on the shelf and in the field.
Teams design a clear pack-price architecture. A compact premium pack costs 15% more per unit than the standard size. The logic holds.
In-store execution undermines it. The pack sits next to a larger alternative, with no signage and no planogram compliance.
The strategy is good, but the visibility fails.
The same pattern repeats across each of the net revenue management levers. Teams plan trade promotions on historical averages, then review results two to three weeks later. By the time insights reach the NRM team, the promotion has ended, and the budget is spent.
If there’s no system to connect investment, execution, and outcomes in real time, net revenue management loses effectiveness.
This is a data infrastructure problem, not a strategy problem.
How Does Data Visibility Actually Affect NRM Outcomes?
Data visibility lets teams spot and fix issues while promotions are still running, not weeks later. This is where modern net revenue management starts.
One of our clients, a global confectionery brand, faced exactly this problem. They operate across tens of thousands of small traditional retailers. Controlling trade spend at this scale is one of the most common FMCG challenges in markets where traditional trade dominates. And when a team tracks all commercial agreements manually, it’s grueling and ineffective.
As a result, visibility lagged, and loss-making agreements were identified only after the fact. It was seriously limiting any meaningful trade promotion analysis.
By digitizing trade agreements with SSBS’s Trade Promotion Management software, PromoTool, the company gained near-real-time insight into promotion performance by outlet.
Now, automated alerts highlight unprofitable agreements, and the team can respond before additional budget is lost.
That’s the shift. From finding out what went wrong in a quarterly review to fixing it while it’s still happening with the right net revenue management solutions.
The Five Pillars of Net Revenue Management
| The five net revenue management levers at a glance | |||
| NRM lever | Main issue | What’s missing | Impact |
| Brand portfolio strategy | SKU overload, hidden cannibalization | Store-level visibility | Lost margin, inefficient spend |
| Pack pricing | Good strategy, poor in-store execution | Shelf compliance data | Premium not realized |
| Mix management | Data too aggregated and delayed | Customer/channel-level insight | Missed margin opportunities |
| Trade promotion | Delayed feedback on promotions | Real-time execution + sell-out | Low ROI, wasted budget |
| Trade terms | Decisions not tied to profitability | Customer-level P&L visibility | Margin erosion |
Brand Portfolio Strategy
Most FMCG teams define their portfolio roles as fighter, mainstream, and premium. However, this remains an internal classification, and teams often lack visibility into whether that structure actually holds at the shelf in real time.
SKU proliferation (adding too many product variants without enough incremental value) drives the problem.
Products keep getting added. Each launch makes sense in isolation. Over time, the portfolio fills up with SKUs that take shelf space, absorb trade spend, and cannibalize higher-margin products.
Monthly reports don’t reveal this. Store-level shelf data does.
Signs your portfolio is dragging performance:
- Distribution grows, but revenue doesn’t keep pace
- Shelf coverage looks strong, but premium facing declines
- Promotional spend per SKU rises, while lift stays flat
Fixing this doesn’t always mean cutting SKUs. Often, it means giving more shelf space to higher-margin products and shifting field reps’ time toward stores and SKUs that actually drive sales. That decision depends on store-level data: what’s on the shelf, how it’s displayed, and how each SKU is performing.
Pack Pricing
Pricing architecture is designed in spreadsheets and implemented by field reps in stores, where planogram compliance may be inconsistent. That gap between planned and actual is where pricing monetization is lost.
Connecting pack pricing strategy to shelf execution data is crucial for net revenue management in FMCG. Image Recognition technology, running on field reps’ mobile devices, captures shelf photos at scale. It shows exactly how products are placed, priced, and displayed, almost in real time.

Reckitt Benckiser rolled out SSBS’s AI Shelf Recognition across multiple markets, including France. Their field reps cut time spent on shelf audits by 30% and used that time to fix what actually affects sales: correcting placement, flagging pricing issues, and working with store managers.
For pack pricing, three functions make the difference:
- Price monitoring: checks if the price set for each channel is actually on the shelf
- Assortment matrix: confirms the right SKUs are present in the right stores
- Shelf share tracking: shows whether premium packs get enough space to justify their price
So, teams see exactly what the shopper sees, and fix it on the spot.
Image Recognition built for FMCG shouldn’t just work in well-lit modern retail. The SSBS IR solution, for example, is designed to operate in bars, pubs, and traditional trade environments, recognizing inventory and product placement even with poor lighting.
Active Mix Management
Active mix management is part of net revenue management in CPG, where businesses actively monitor how revenue and margin split across SKUs, customers, and channels, and adjust them.
Teams claim they manage the mix, but rely on aggregated, delayed data that hides what’s happening in key customers. By the time shifts in margin and SKU performance appear, the damage is already done.
Active mix management replaces this with weekly, customer-level tracking. It combines sell-in, sell-out, and shelf execution data to see what shoppers actually encounter and adjust the mix in time.
Trade Promotion Optimization
Most Trade Promotion Management зlatforms do exactly what the name says: they manage promotions. The promotional calendar, uplift forecasting, post-event ROI. That’s the scope.
The problem is that trade spend doesn’t stop at promotions. Contracts, volume rebates, logistics terms, commercial investments negotiated with key accounts: these often live in spreadsheets or separate finance systems, invisible to the people planning and evaluating promotional activity.
You can optimize every promotion perfectly and still have hundreds of millions in trade investment that nobody has full visibility into.
SSBS’s PromoTool is one of the examples of tools addressing this. It covers Trade Promotion Optimization and the entire trade spend management cycle. The solution brings contracts and commercial conditions into the same system where promotion planning and execution take place.

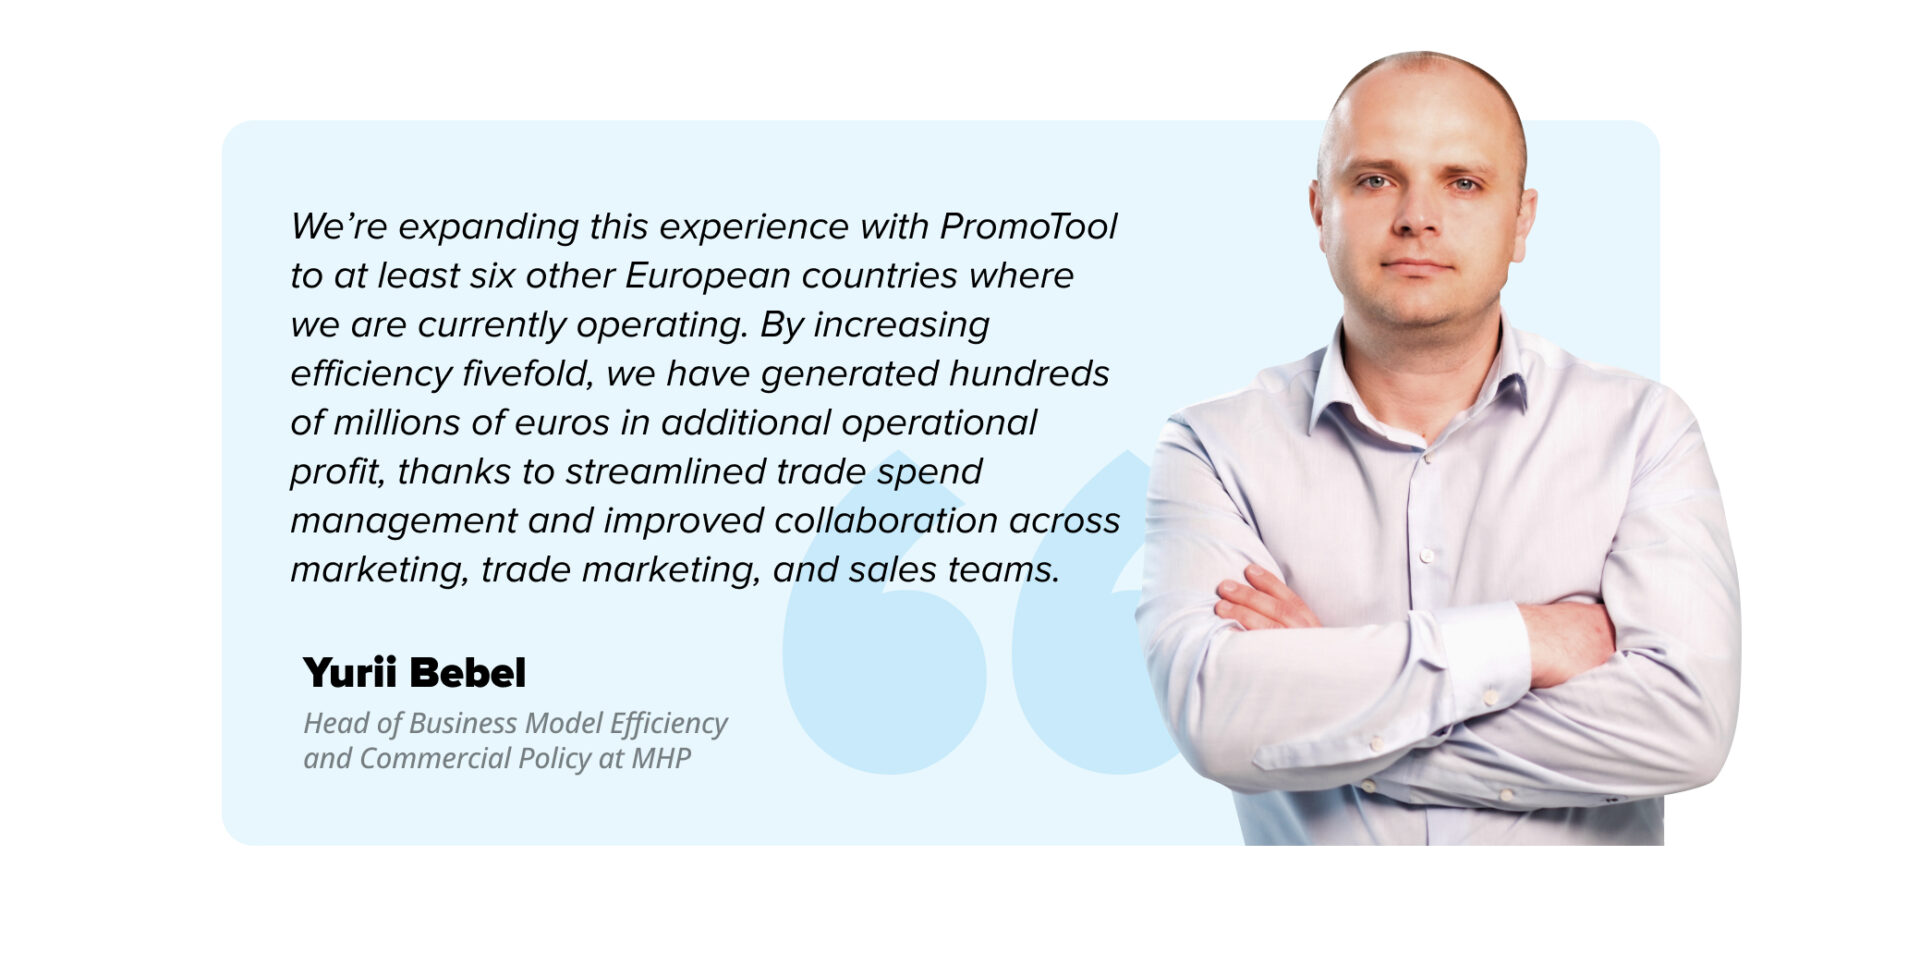
A leading poultry producer and exporter implemented PromoTool for exactly this reason. Within one year, operational efficiency increased fivefold. The company unlocked hundreds of millions of euros in additional value, not from better promotions alone, but from bringing sales, marketing, and finance onto the same data for the first time.
PromoTool includes AI agents that work through a chat-like interface. Your team can type questions and requests in plain language, and the system runs calculations, surfaces information, and performs actions inside the platform. No need to know where the data lives or how to query it.
Trade Terms
That’s usually one of the most under-managed net revenue management levers.
Trade terms are where the most significant net revenue impact occurs and where the least net revenue management analytics is applied.
Brands negotiate annual terms without seeing true customer profitability. They structure volume rebates that push the wrong behavior. Logistics costs chip away at margin, unnoticed. These are not edge cases. They are standard in organizations where trade terms sit outside the NRM workflow.
Leading companies fix this by building customer-level P&Ls and tying them directly to trade terms. They walk into negotiations with clear numbers on what each customer actually contributes. They stop rewarding volume alone and start pricing for profit.
How Data and Analytics Support Net Revenue Management
| Three shifts that separate reactive NRM from connected NRM | ||
| What most teams do | What changes with connected data | |
| From intuition to data-driven decisions | Review pricing and promotions quarterly based on averages and gut feel | Adjust by store, channel, and SKU based on live commercial data |
| Using price, promotion, and channel data | Each data source lives in a separate system, reviewed in isolation | TPM, SFA, IR, and sell-out data connect into one commercial picture |
| Turning insights into better commercial decisions | Recommendations debated across functions, reach the field weeks late | Live data reviewed in weekly routines, decisions acted on while they still matter |
Read also a breakdown of the best Revenue Management software.
From Intuition to Data-Driven Decisions
The shift from gut-feel to data-supported decisions happened a decade ago. That’s the baseline now.
The shift happening today is different:
- Before: monthly sales reports, national averages, decisions made after the quarter closes
- Now: store-level data updated weekly, visibility by outlet and SKU, decisions made while they still matter
Using Price, Promotion, and Channel Data
Price, promotion, and channel data are the three core inputs to net revenue management analytics. The problem is that they usually live in separate systems:
- TPM platform: promotional investment and trade spend
- Retailer data: sell-out results by outlet
- SFA: field execution and visit data
- Image Recognition: shelf compliance and pricing photos
Each is useful alone. Together, they answer the question that actually matters: did this promotion deliver, and why or why not?
Turning Insights into Better Commercial Decisions
Insight is rarely the bottleneck. The bottleneck is the distance between insight and action:
- Analytics team produces a recommendation
- Commercial teams debate it
- Decision reaches the field weeks later
- The market context has already changed
Closing that gap takes two things: commercial routines built around live data, and field teams equipped with the right tools to act quickly. The first is a process change. The second is a technology one.
So, what does a commercial setup that delivers all of this actually require? Here’s the answer.
What Good NRM Infrastructure Actually Looks Like
Good NRM infrastructure is connected. That’s the simplest way to say it.
A TPM platform that doesn’t talk to field execution data tells you what was planned, but not what happened. An SFA system that doesn’t connect to trade terms management tells you visit frequency but not whether visits are focusing on the right issues.
The organizations closing the gap between a net revenue management FMCG strategy and net revenue management outcomes are building the right commercial infrastructure. What makes it good is that shelf data, field execution, trade investment, and pricing decisions are all brought together in a single view. The key components are:
- Sales Force Automation FMCG (SFA) that provides visit frequency, task completion, order placement, and in-store execution data, all in one system.
- Image Recognition (IR) that converts shelf and store photos into structured execution data.
- Trade Promotion Management (TPM/TPO) that covers the full trade spend, connecting promotional planning, execution tracking, and post-event analysis.
- B2B FMCG eCommerce, which shifts routine order placement online, freeing field reps for value-adding activities.
- Territory Management (often a part of SFA) and Distributor Management – tools to control route-to-market efficiency and partner execution.
Each of these can work independently. The value of compounding comes when they share data.
What Happens When You Connect Field Sales to NRM Data
One of the clearest illustrations of what connected infrastructure changes is what happened with a global pet food brand that sells through national retail chains, independent pet shops, and specialized pet retail chains.
Key account managers at this company were spending roughly 75% of their in-store time taking orders. That’s what the SFA data showed, and it was a significant finding.
These weren’t low-value accounts: specialized pet retail chains were strategic partners who supported new product launches, category development, and in-store promotions. KAMs were spending their most valuable relationship-building time on data entry.
The fix was to shift order placement to SSBS’s B2B eCommerce platform. Because these retailers were already engaged in long-term cooperation with the brand, adoption was straightforward. They were willing to move to ordering online.
The result: KAMs got their time back. Field visits shifted toward partnership development, promotion execution, and category growth conversations. The activities that actually protect and grow net revenue.
The SFA data made the problem visible. The B2B eCommerce platform removed it. This is what connected infrastructure looks like in practice.
How to Start Building Net Revenue Management Infrastructure
You don’t have to replace everything at once. That’s actually the wrong way to approach it.
The practical path starts with three steps:
- Identify where your biggest revenue leakage is concentrated. In most FMCG organizations, a huge share of net revenue loss comes from a small number of customers, promotions, or SKUs. Find that concentration first. It’s where infrastructure investment will pay back fastest.
- Choose the data connection that closes the most important gap. If your biggest problem is promotional ROI, that points to connecting TPM with execution and sell-out data. If it’s field productivity, that points to SFA and route optimization. Start with the connection that matters most to your specific NRM situation.
- Build commercial routines around the new data. Infrastructure without process doesn’t work. The data needs to be reviewed at the right frequency, by the right people, with clear ownership of the decisions it informs. Start with weekly commercial reviews.
The next practical question is whether this has to be a one-provider decision.
Technically, it doesn’t.
But every additional vendor means another integration to build, maintain, and troubleshoot. Data that lives in separate systems from separate providers doesn’t flow automatically.
A single-provider ecosystem solves this by design. Solutions built to work together share data natively. The commercial picture updates as a whole, not in disconnected fragments.
SoftServe Business Systems provides exactly this kind of ecosystem for FMCG and CPG brands.
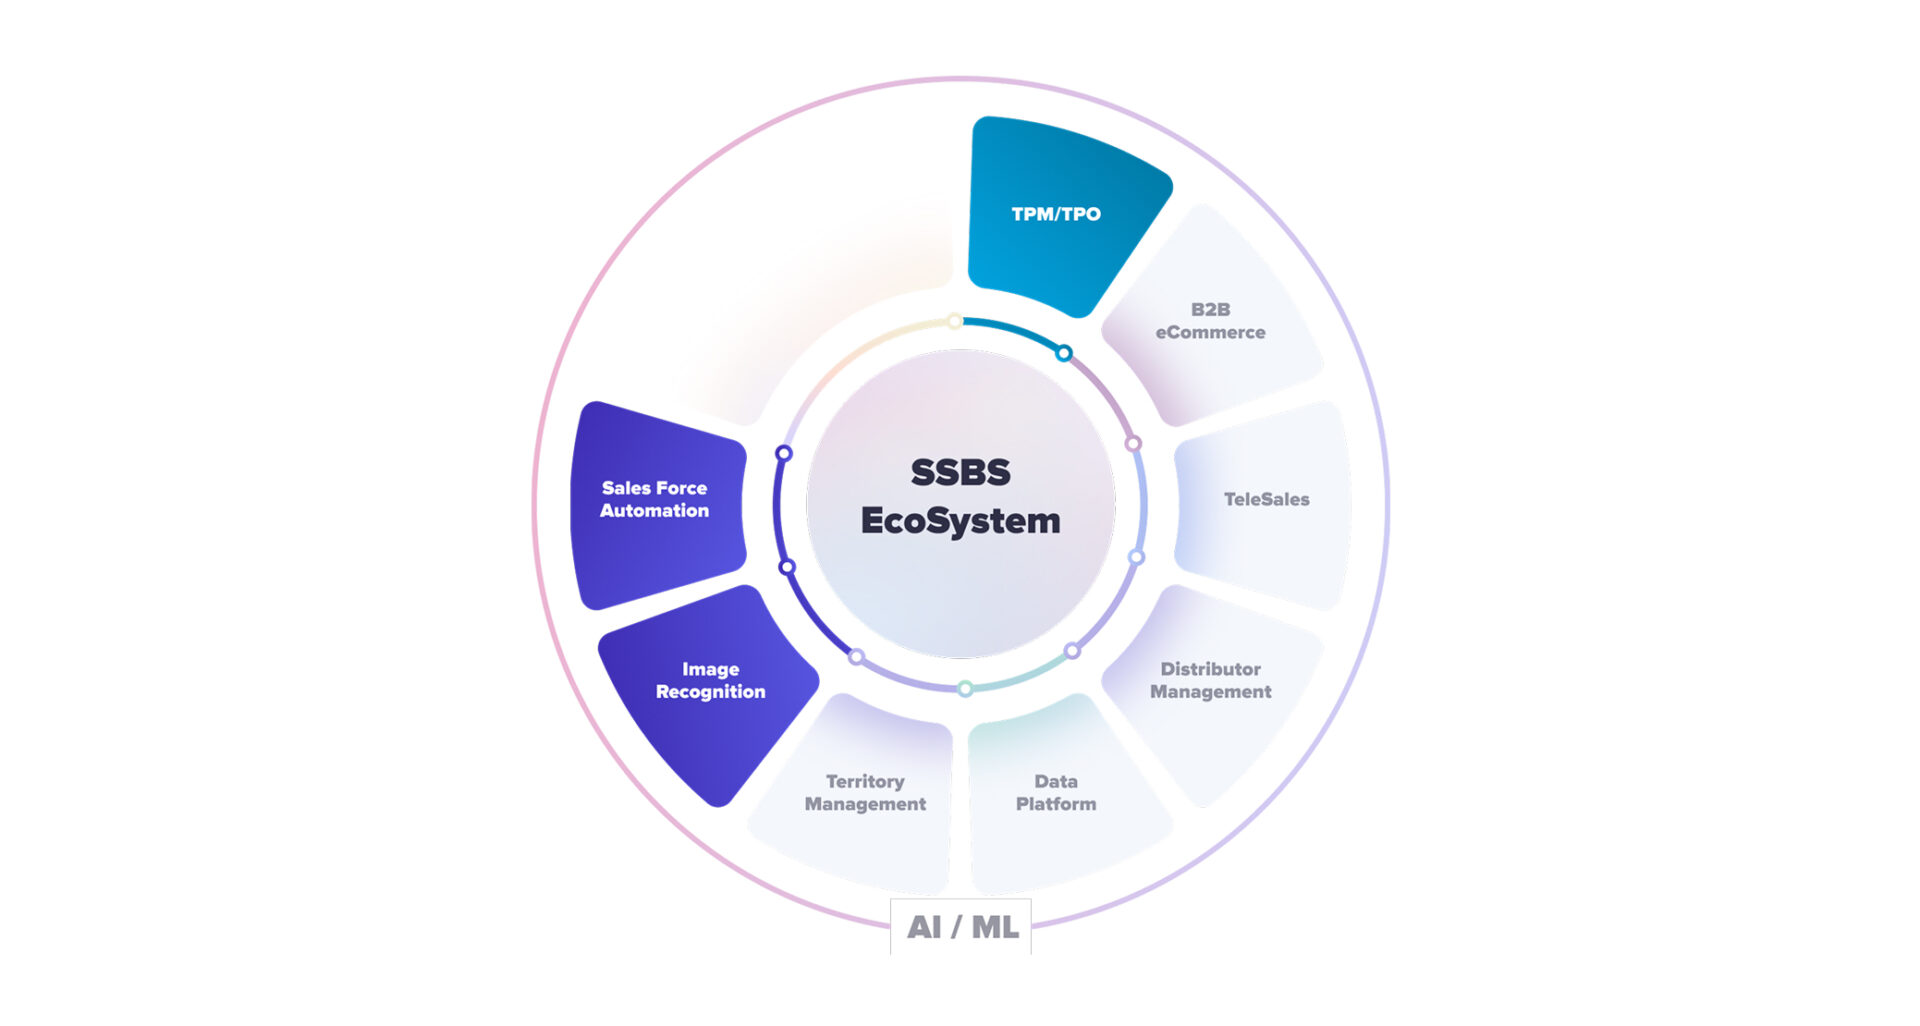
The solutions cover the full commercial stack: Sales Force Automation, Image Recognition, Trade Promotion Management, B2B eCommerce, Territory Management, Distributor Management, and B2B TeleSales.
Each works independently and integrates with your existing infrastructure. Together, they give you the connected commercial picture that enables your net revenue management decisions to be faster and more grounded.