Imagine your CRM, Excel sheets, and BI tool all show different numbers. Sounds familiar? For most FMCG directors, it’s not a thought experiment but a daily reality. And when the numbers don’t match, the only way to decide which ones to trust often comes down to “gut feeling” built on years of experience.
This isn’t just about the frustration of uncertainty. It’s about the very real losses that weak analytics for FMCG companies create: time wasted reconciling reports, money lost from misinformed decisions, and trust eroded between departments, each defending its own version of the truth.
So how can leaders make crucial decisions when data (their supposed single source of truth) pulls them in different directions?
Short answer – with a completely new approach to FMCG data analytics.
Long answer with tips on how to apply it – read further.
Where We Are Stuck: Why Classic FMCG Data Analytics Approaches Don’t Work
How was data historically handled by FMCGs (and it’s still true for many companies)?
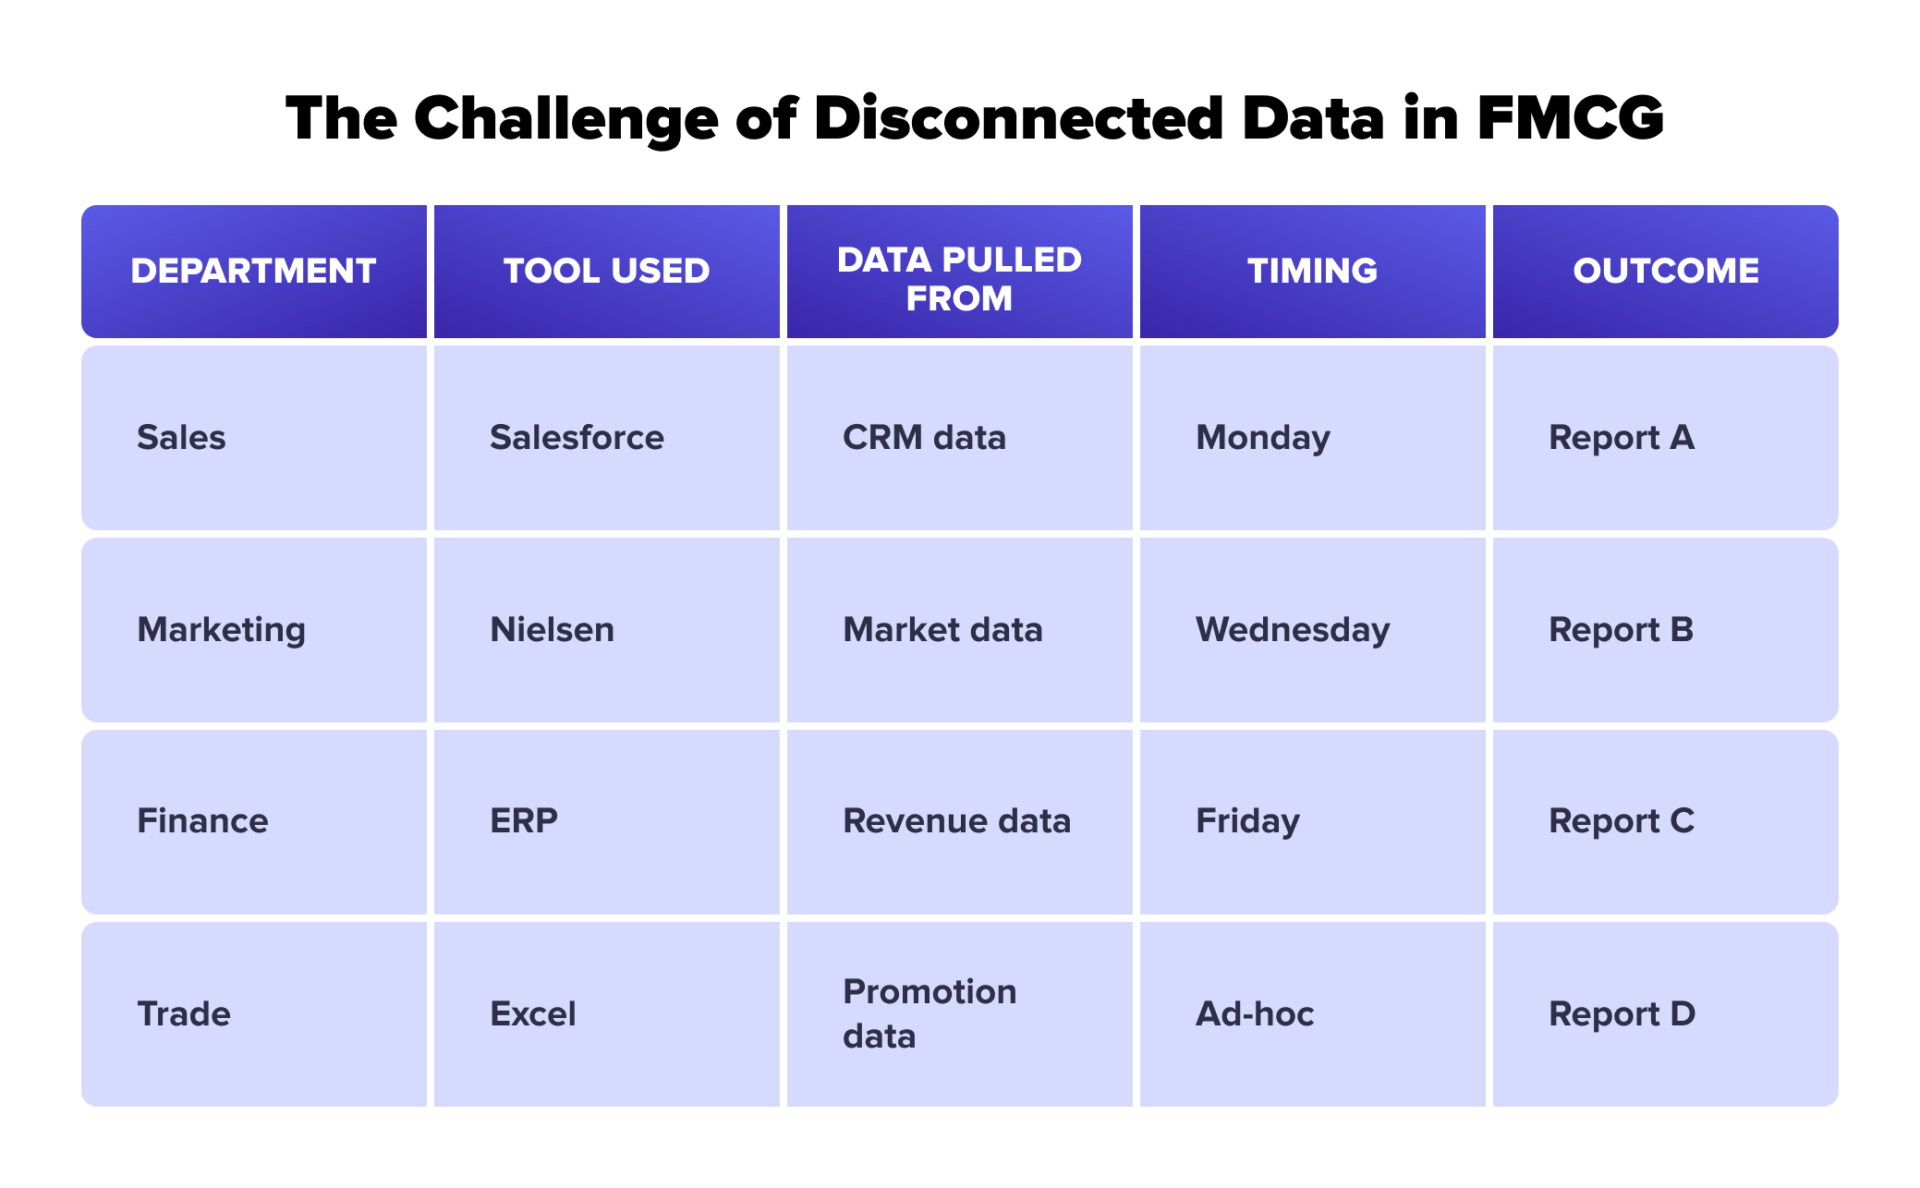
Each department had its own tools, like ERP, TPM, Sales Force Automation for FMCG, Nielsen, or Excel. Many also relied on a separate tech infrastructure, focused only on the KPIs and data relevant to its function.
Field teams, for example, could use only Computer Vision in FMCG (in the form of FMCG Image Recognition), while sales managers could rely on FMCG Distributor Management. And each of the systems wasn’t connected to the others, making it nearly impossible to get a complete, accurate view of the business.
The result?
- Different data sources
- Disconnected systems
- Different departments are spending time duplicating the same data
- No single version of the truth
When someone needed a consolidated view, it usually meant assigning the task to a data engineer and waiting. The engineer would pull data from various sources, clean it, and process it. Only then could the final report be generated – sometimes long after the insights were actually needed.
Without a set update schedule, people pull data at varying times. Hence, reports meant to show the same reality often end up showing inconsistent numbers. Simply because they were generated on different days or from slightly different data cuts.
One team makes a decision based on “yesterday’s truth,” while another acts on “last week’s truth.” The outcome is the endless Zoom fights over whose numbers are “the right ones.” It’s one of the biggest challenges in the FMCG industry these days.
All of this isn’t just an operational headache. It’s data chaos, and very expensive for business, draining time, budgets, and trust between teams.
What to do with that? We have a solution.
A New Approach – Completely New Logic
Gathering all of the big data an FMCG company has in one shared space may seem like a good idea, considering all of the above. However, if you think about one giant spreadsheet for everyone, or a software with different dashboards for all imaginable purposes, you’re thinking slightly wrong. It would be an even messier solution than what most companies have now.
The new logic works differently and has a higher level of FMCG automation.
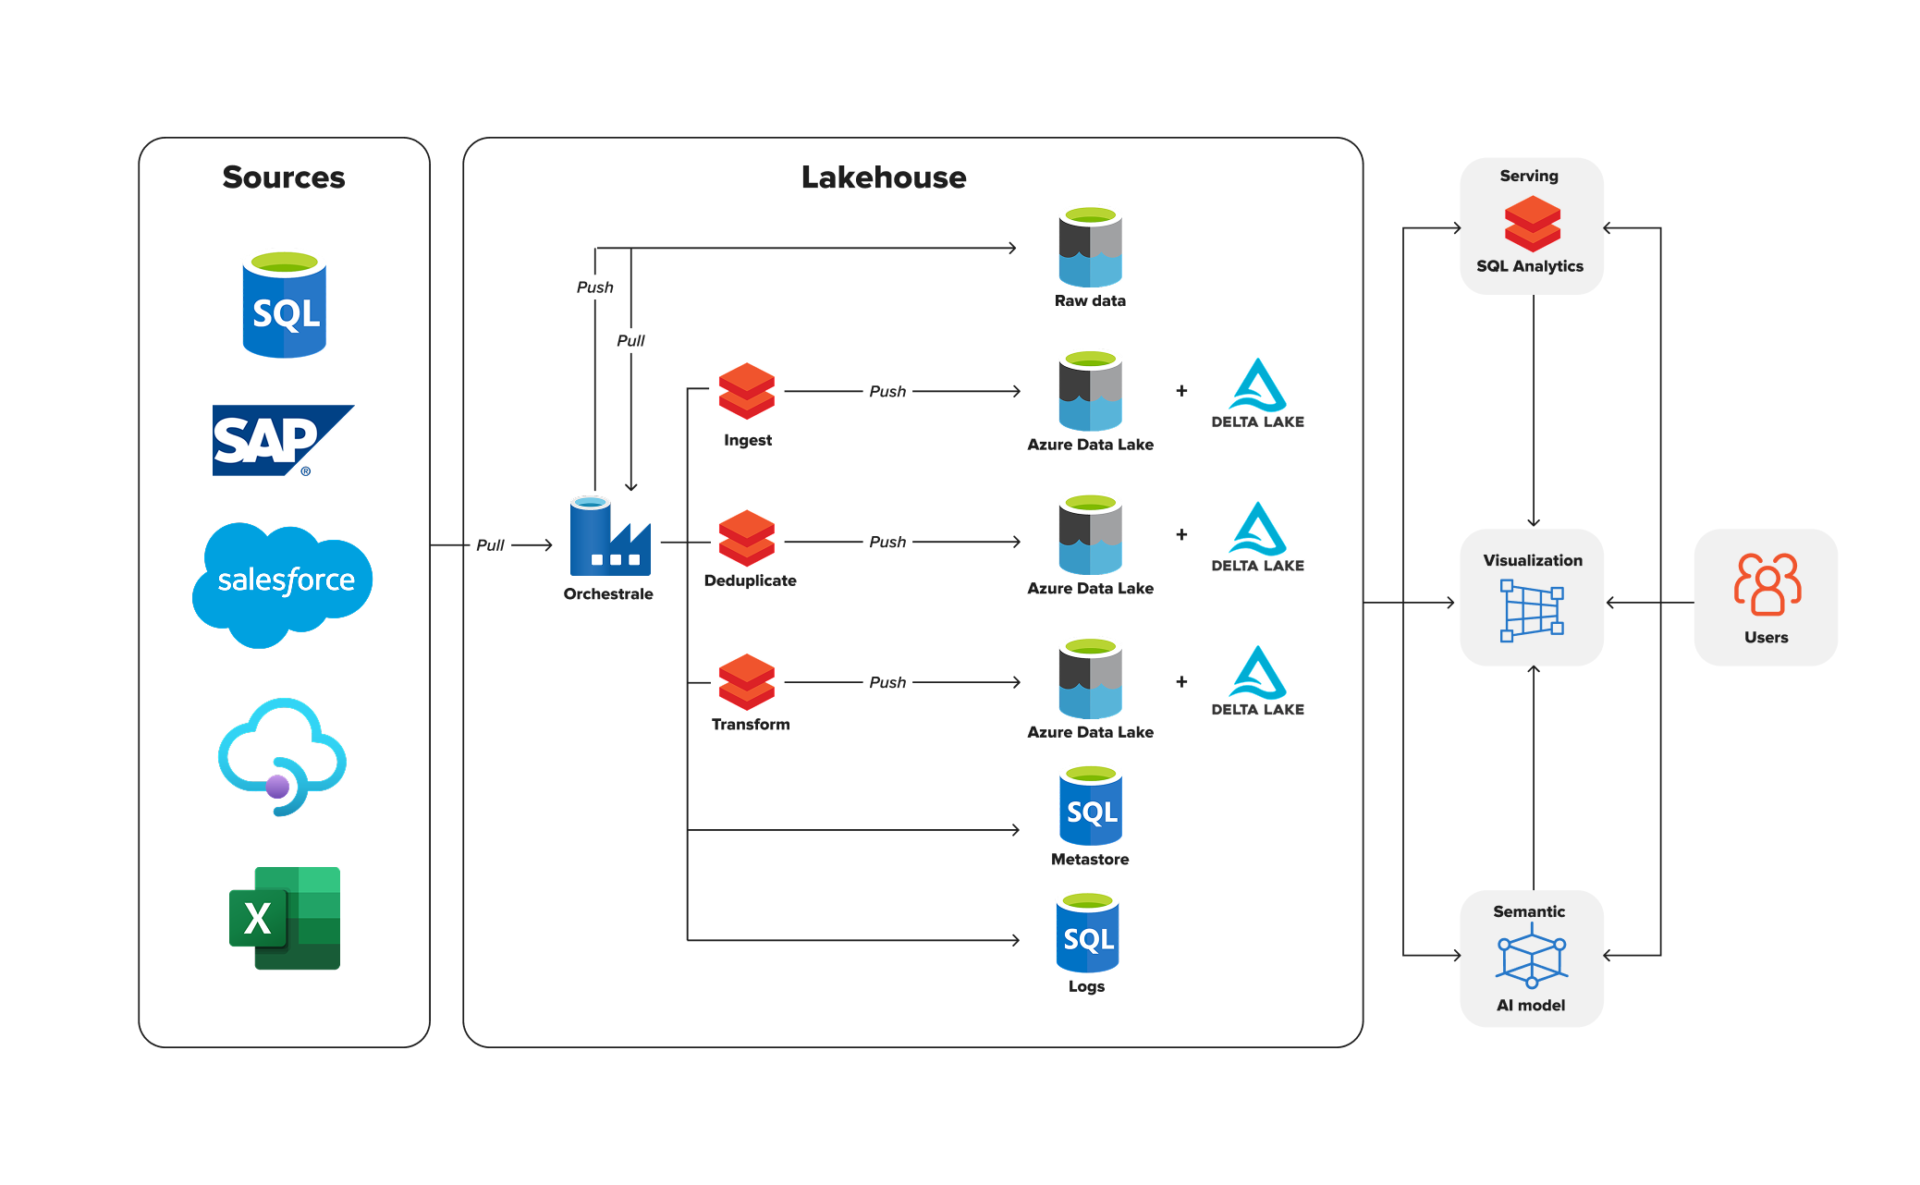
Picture an FMCG data analytics platform where all types of data (structured, unstructured, raw, and transformed) are stored in a single environment, organized in layers – a joint source of truth.
From there:
- The system processes data both in scheduled batches and in real time.
- It ensures the right people have the right access.
- Data remains trusted, consistent, and traceable from source to final report.
Each team then works with its own data project, designed for its needs, aligned to its logic, always fresh, and fully reproducible. The system not only provides business-ready analytics, but also keeps a record of every source and transformation, so nothing is lost in translation.
- Not one giant spreadsheet for everyone, but one trusted source feeding each separate, team-tailored data product.
- Each team gets its own customized reports, built on the same foundation.
- The question shifts from “whose version is right?” to “what do the numbers tell us?”
Let’s move from theory to practice and see this approach in action.
Taking control of your data creates opportunities to adopt more AI-driven solutions. Learn why AI agents in the FMCG industry are among the most promising.
How Data Products Work in Real-Life FMCG Analytics
Not many teams have had the chance to apply the data products approach yet. But SSBS’s clients have, and here’s what they’ve experienced.
Before vs After: Sales Reporting
Previously, after every promotion, the Sales team had to collect numbers from different systems and stitch them together in Excel. It took at least 3 days before the report was ready.
Now, the same report appears in the dashboard in 15 minutes, with no manual work. The impact this speed can have on FMCG sales strategy is huge.
Before vs After: ROI Alignment
Previously, Finance and Marketing calculated promo ROI in different ways. Marketing looked at incremental sales, Finance at profit margins, and the numbers never matched.
Now, both teams use standardized business metrics, so discussions focus on results instead of who has the right version.
Before vs After: Data Refresh
Previously, data updates happened once a week. By the time a new report was published, the situation in stores had already changed.
Now, data refreshes almost in real time, letting teams react the same day instead of waiting until next week.
Want to know how to achieve such results and reduce manual data processing by 80% just like our clients? We will help you with that!
Want to know how to achieve such results and reduce manual data processing by 80% just like our clients? We’ve got a detailed guide for your IT department.
Where to Start with Analytics in FMCG Reinvention
Building a new system and completely changing the way data is handled may seem challenging. But you don’t need to do it all at once. In fact, trying to solve every problem on day one is the fastest way to get stuck. Instead, here are three manageable steps to get started with your new FMCG analytics approach.
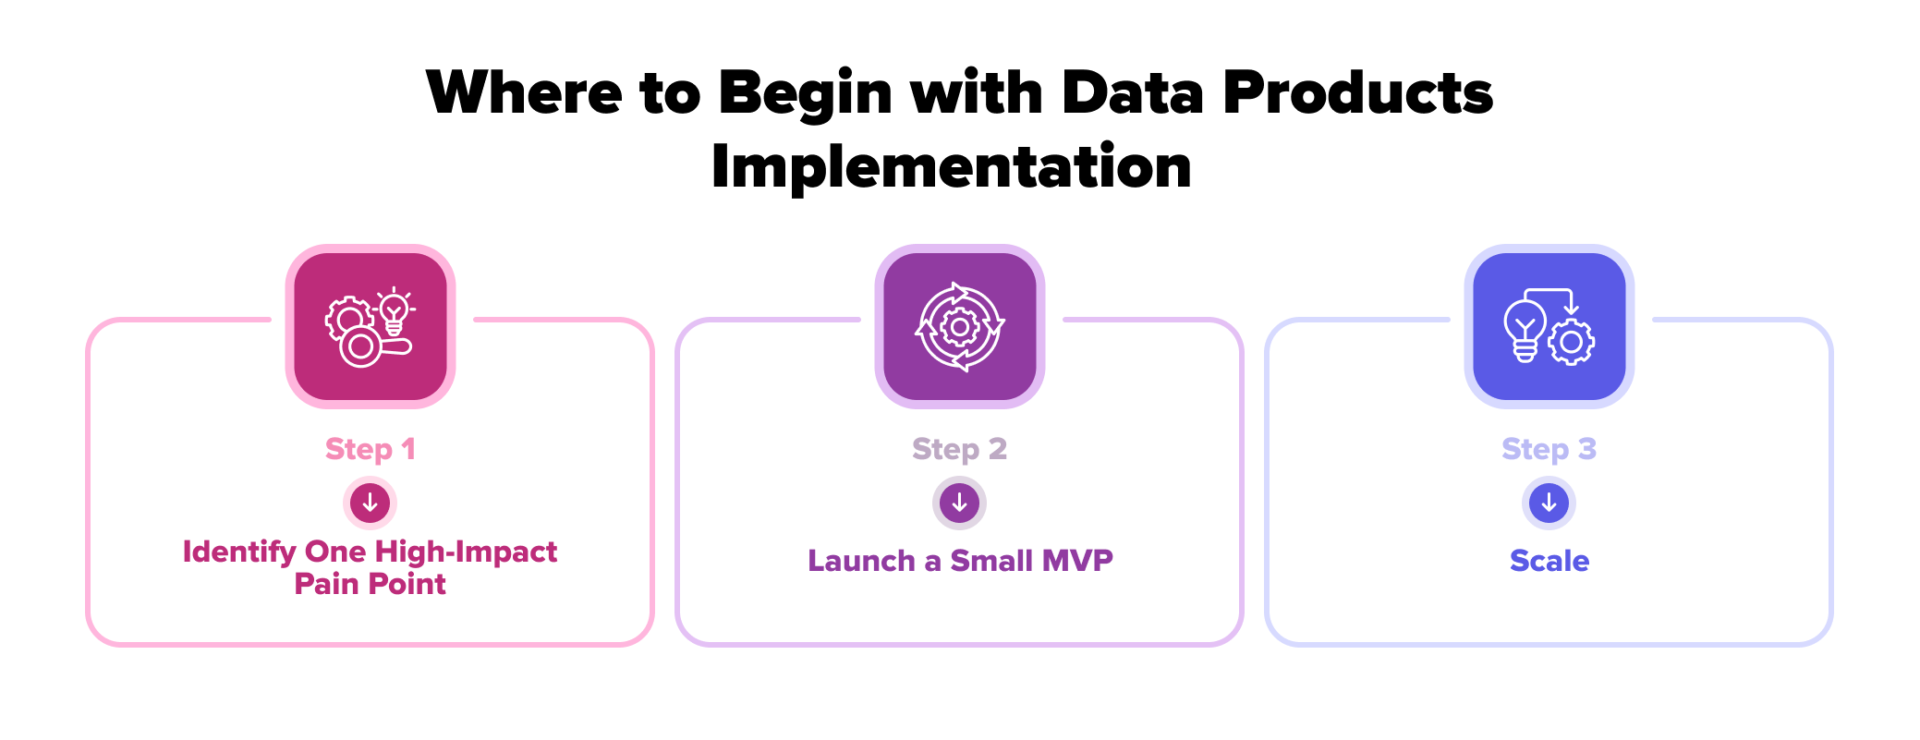
Step 1. Identify One High-Impact Pain Point
Pick one problem that everyone feels. It could be one of these:
- Promo analytics, which always takes days to compile
- The constant back-and-forth between sell-in and sell-out numbers
- Disconnected reports across departments
Focusing on a tangible, shared pain point ensures immediate value and buy-in from the team.
Step 2. Launch a Small MVP
Start small and test with one team or process. A minimal viable product proves that FMCG analytics doesn’t need to be overwhelming – it can begin with a single workflow.
- Build a minimal viable product that addresses the chosen pain point.
- Test it, gather feedback, and observe what works and what doesn’t.
Improving a working pilot is far easier than trying to design the “perfect” system upfront.
Step 3. Scale
Once one domain (for instance, Sales) is successfully up and running, the next step is to expand the new approach to other areas such as Procurement, Finance, or Logistics.
- Use what’s already built – apply existing rules, calculations, and access permissions instead of reinventing them. This ensures consistency across all FMCG analytics use cases.
- Grow step by step – introduce new domains gradually to keep adoption controlled. For example, expanding from sales into marketing analytics in FMCG can help link promotions with supply chain insights.
- Create a catalog of all available data products with clear intended users to ensure accountability.
Conclusion
Everything changes when FMCG teams learn to trust their data. Decisions become faster, plans more accurate, and debates over conflicting reports fade away. Teams stop spending hours reconciling spreadsheets or arguing about which KPI is correct. Instead, they spend their energy analyzing results, spotting opportunities, and acting.
It’s time businesses started solving modern data problems with modern solutions. Adopting the data products approach makes analytics for FMCG companies transformative. Data becomes actionable insights, driving better promotions, improved management of inventory levels, and quicker responses to market shifts.


