Around 80% of grocery and FMCG purchases in Europe still happen in physical stores.
At the same time, shelf space is becoming more limited.
Private labels already make up over 30% of sales in Europe. Retailers keep expanding these ranges, often giving them the best placement.
Thus, brands are facing reduced visibility and weaker negotiating positions.
Even when shelf space is secured, it is not always maintained.
A Cognizant study found that only about 57% of retailers have systems in place to consistently measure planogram compliance. Meanwhile, adherence can drop by around 10% within a week after a planogram reset.
Brands that maintain their position in this environment do more than track Share of Shelf. They build processes around it.
This article explains how to calculate Share of Shelf, what helps protect shelf share, and which technologies support this work.
Let’s start from the basics – the definition.
What is Share of Shelf (SoS)?
Share of Shelf (SoS) shows how much space a brand occupies within a category.
It is one of the oldest retail metrics. Yet in practice, it often gives an incomplete and delayed view of what is happening in-store.
What basic SoS does not show:
- Placement – eye level vs. bottom position
- Context – next to strong sellers vs. low-traffic products
- Competition – adjacency to private labels vs. other brands
Two brands can have the same SoS but very different results simply because of their placement.
It also ignores how space is won:
- Negotiated facings (secured through agreements or promotions, often temporary)
- Performance-driven facings (based on sell-through, more stable over time)
A brand may see its 30% share and assume it is secure, without realizing it depends on a temporary agreement rather than actual performance. However, the standard SoS reporting treats them the same.
It doesn’t mean brands shouldn’t measure SoS. It means the measurement must be done in a way that reflects context.
How to Calculate Share of Shelf
There are two Share of Shelf calculation approaches: one based on facings and the other on linear share.
Facings
This Share of Shelf formula counts how many product fronts your brand has compared to the total.
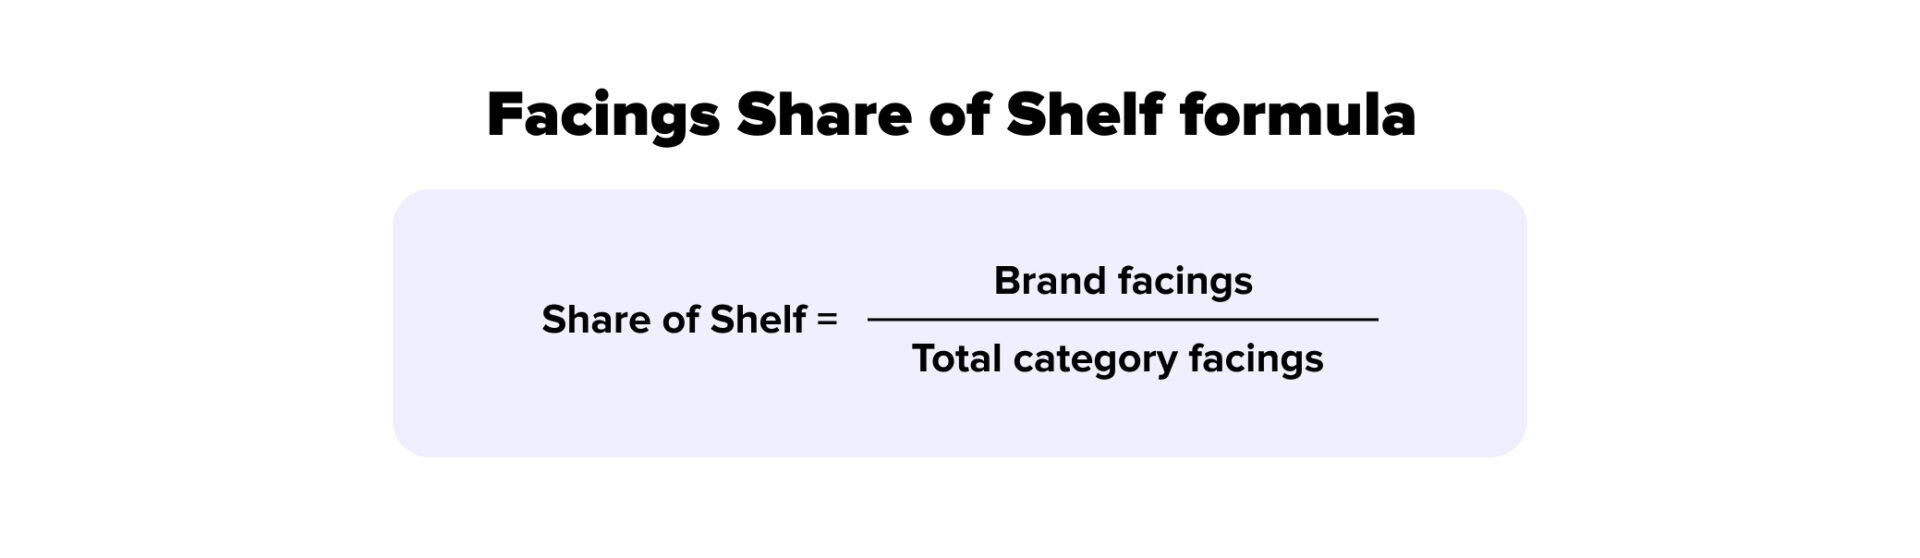
This Share of Shelf analysis method works well when products are similar in size. However, it becomes misleading when they are not.
Smaller or narrower products can fit more facings into the same space. It increases the count without increasing actual presence.
As a result, a brand with compact packaging may show a high SoS while occupying relatively little space.
Linear Shelf Space
To track Share of Shelf using this approach, measure how much physical space a brand occupies on the shelf.

This Share of Shelf formula also has its bias.
Wider packaging can take up more space, even with fewer facings. A product may visually dominate, while being weaker in face-based metrics.
What Method to Prioritize
If you measure the wrong thing, you optimize for the wrong outcome. How to measure Share of Shelf by category:
- Confectionery / small-packaged goods – prioritize linear space (facings can be misleading)
- Beverages – use both (packaging varies, visibility, and volume both matter)
- Household care / large items – prioritize facings (each facing carries more weight)
Importance of Shelf Share
Let’s discuss the value of SoS in an environment with limited space and high competition.
Strengthens Brand Visibility
A large share of purchases is influenced by what consumers see first, especially in high-traffic areas. Thus, more space increases the chance of being seen.
Shapes Buying Decisions
Wider product presence is also linked to higher purchase rates, research shows. Consumers tend to choose products with more facings (e.g., 25 vs. 5), often seeing them as more reliable.
Creates a Competitive Advantage
When a product goes out of stock, store staff often fill that space with other products. Or they don’t restore the original layout exactly as planned.
Thus, out-of-stocks are often tied to lost presence and lead to 43% of shoppers switching brands. Some consumers even leave the store altogether. In both cases, competitors benefit immediately.
Reveals Growth Opportunities
Share of Shelf analysis becomes useful when it identifies gaps and changes. In practice, this means tracking:
- Where your share is lower than your sales performance (brand underrepresented overall)
- Where certain SKUs are missing or underrepresented (assortment gaps at the SKU level)
- Where distribution does not reflect demand (products are missing in stores where they should be present)
These are signals for expansion, renegotiation, or adjustment in assortment.
Measures Brand Visibility
Beyond outcomes, SoS is also a diagnostic tool. It helps answer:
- How often are shelf conditions checked
- Whether visibility is consistent across stores or regions
- How actual presence compares to planned layouts
Without consistent measurement, visibility issues remain hidden until performance is affected.
Tracks Competitor Activity
Regular shelf share tracking shows how the shelf changes over time. Key signals to watch:
- Competitors gaining or losing facings
- New product entries in your space
- Private label expansion within the category
Small changes often occur gradually, but they can lead to significant shifts if left unaddressed early.
Strategies for Share of Shelf Optimization
Modern brands usually use the same SoS optimization techniques. Learning them and putting them in place isn’t the issue. The challenge is ensuring the techniques actually hold up in real stores, day after day. This is where optimization needs to focus.
Prime Shelf Placement
Shoppers’ decisions are fast, with up to 60-70% made in a few seconds and driven by what is immediately visible.
To negotiate the top positioning and the needed number of facings, brands use data that complements their product’s performance.
That’s one of the reasons why many teams use the Revenue Growth Management (RGM) framework. It helps them decide which products deserve more space based on how much they sell, how profitable they are, and how they grow the category.
What retailers are interested in:
- Category performance
How your product contributes to the overall category (e.g., grows sales, attracts shoppers).
- Sell-through rates
How quickly your product sells off the shelf. Faster turnover = more valuable space.
- Contribution to retailer margins
How much profit the retailer makes from your product compared to others.
Basically, if your product sells well, you have a stronger case for better placement.
Shelf Space Protection
Gaining space is just the beginning. Keeping it can be a lot harder.
Early signs of losing space often appear before they show up in reports:
- Gradual reduction in facings
- Products shifting away from central positions
- Competitors or private labels appearing nearby
Compliance data (and the solutions that make it visible) is critical here. We will discuss the specific tools a bit later. For now, the key point is this: without regular visibility into in-store execution, these changes slide unnoticed.
Technology-Driven Optimization
Basically, every modern strategy is a technology-driven strategy, because manual tracking is too slow and inconsistent.
Technology makes shelf conditions visible, helps detect issues early, and allows teams to act faster.
Technology Trends in Share of Shelf Measurement
There are a few types of software that companies use when they have a defined Share of Shelf strategy and want to improve on-shelf availability.
Image Recognition (Computer Vision)
The biggest trends now are Image Recognition for retail and Augmented Reality, which help track SoS faster and more accurately than ever.

Field reps or store staff capture shelf photos using a mobile device. With a simple IR solution, they need a series of photos.
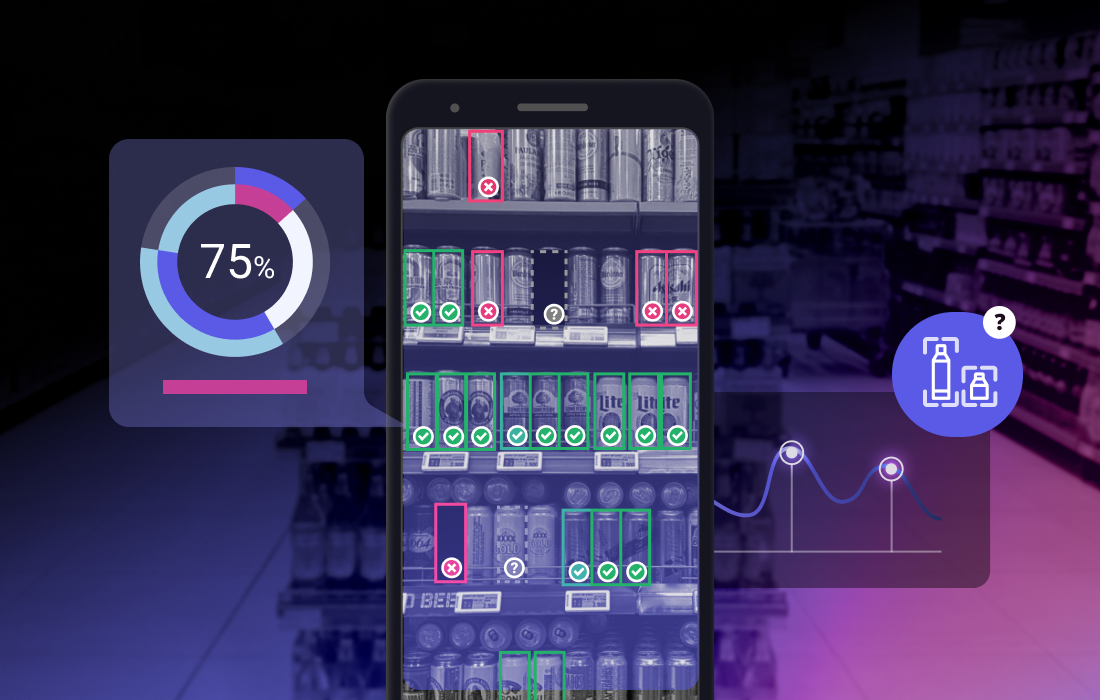
With more advanced, AR-powered FMCG Image Recognition, they can scan the shelf in real time, with the system guiding them and highlighting what is detected.

That’s exactly the solution SoftServe Business Systems offers. The system identifies:
- Number of facings by brand and SKU
- Shelf position (eye level, lower shelf, etc.)
- Planogram compliance gaps
- Out-of-stock or low-stock situations
This removes manual counting and reduces reporting delays, especially if the system can work both online and offline.
More importantly, it creates evidence – visual proof that can be used in discussions with retailers when agreed layouts are not followed.
Trade Promotion Management and Optimization
Trade Promotion Management software also plays a role in Share of Shelf analysis by linking shelf performance to promotional activity and investment.
Some promotions are dictated by retailers, but for those that brands can control, this creates an opportunity to manage them more deliberately.
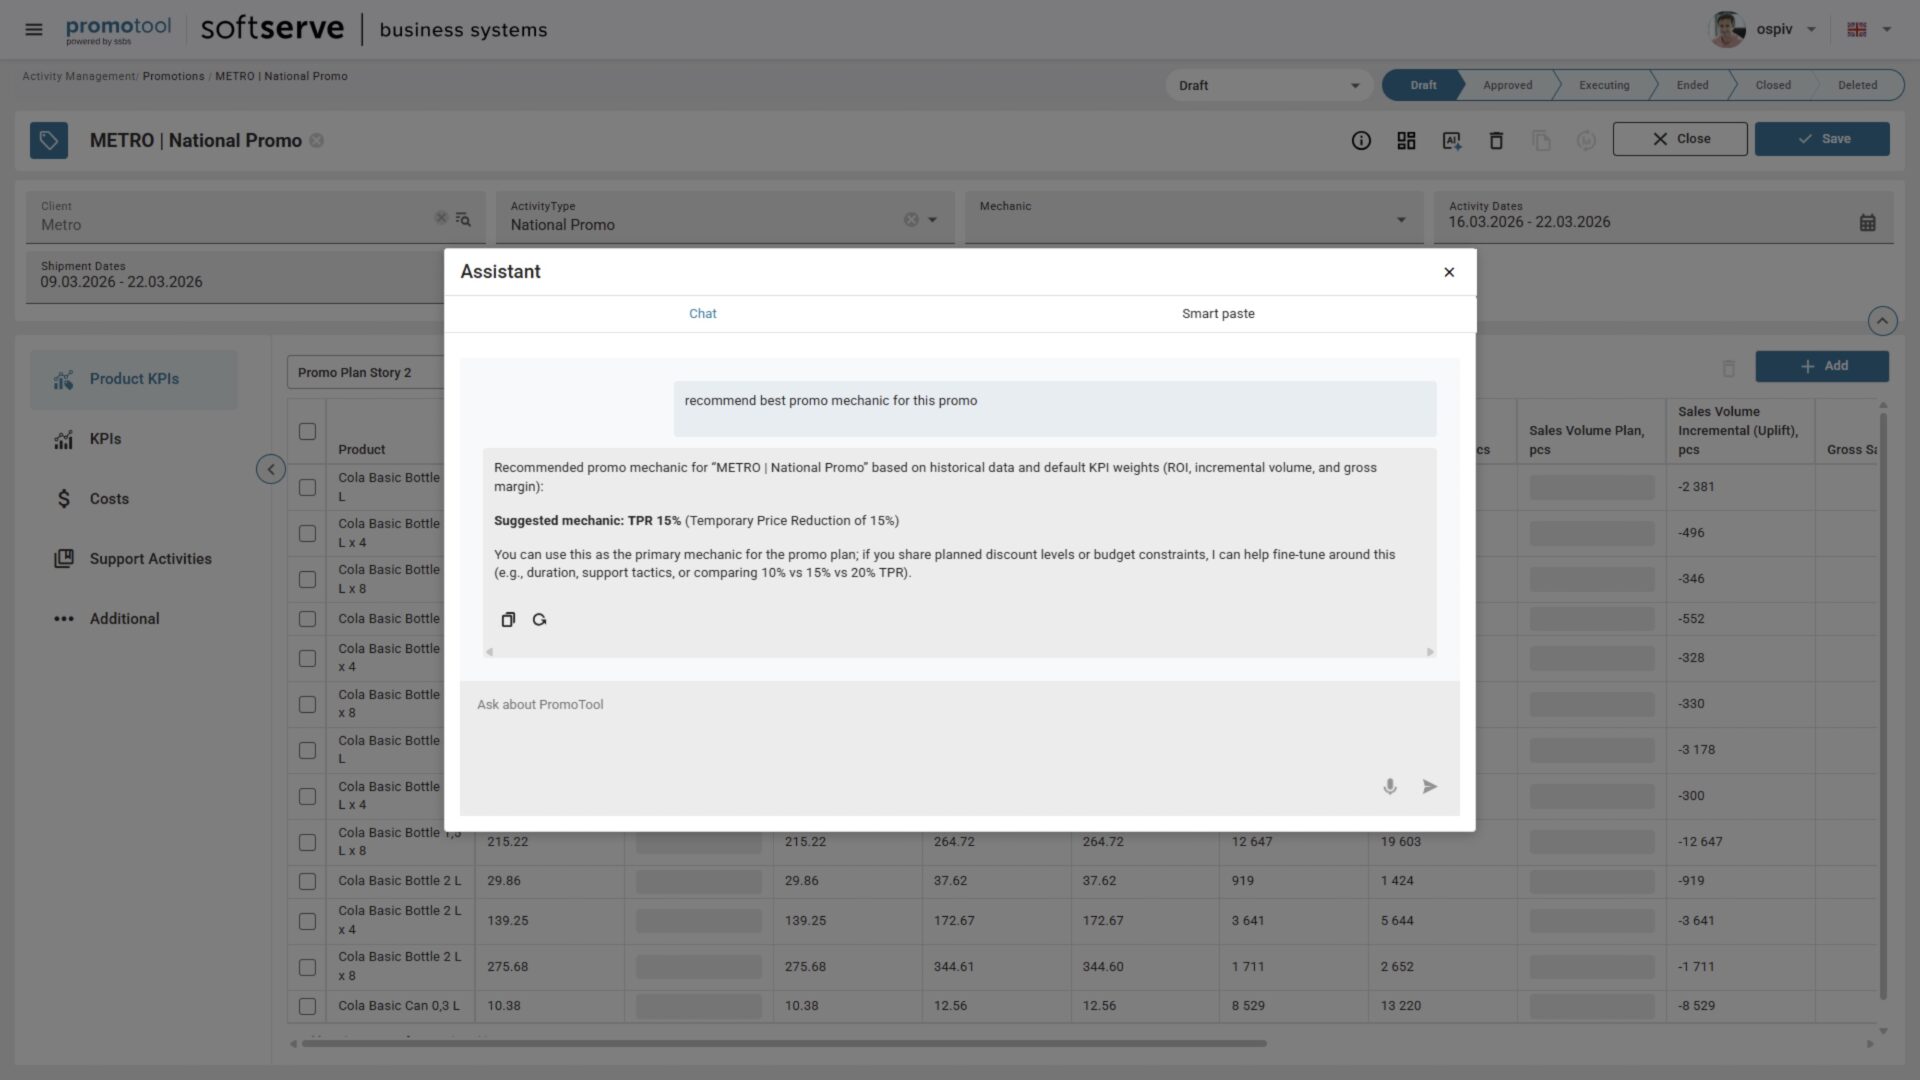
Moreover, TPM/TPO solutions, such as our PromoTool, also support Trade Terms Management. Meaning that contract terms with retailers are stored in one place, including agreements on shelf space, facings, and placement.
Field reps can clearly see what has been agreed for each store, while managers can verify whether it is actually there.
When the solution is AI-driven, the level of insight becomes even more impressive.
PromoTool, for example, combines AI agents and generative AI. As a result, users can interact with the system through a conversational interface and ask questions in simple language. For example, which promotions improved presence, where agreements are not being followed, or which stores require attention.
Conclusion
Share of Shelf depends on three things: brand strategy, what is negotiated with the retailer, and in-store execution.
Yet in many organizations, these areas are managed separately.
Brands with modern technical infrastructure connect these parts operationally and integrate the data behind them.
As a result, they check shelves regularly and fix issues quickly.
Knowing how to calculate Share of Shelf is just the beginning. Spotting small changes early with relevant data and responding to them in time is what protects the shelf share in practice.